Monthly Archives: June 2020

Crosscutting Concepts

By Dr. Lori Andersen, June 2020

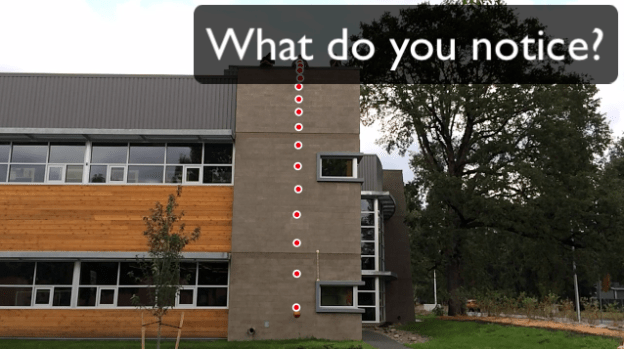
The crosscutting concepts are the “thinking tools” of science. These seven big ideas help us describe and explain our world. Why is it important to use them as a set rather than individually, as they are presented in the standards?

A phenomenon is an object, process, or event. A phenomenon can be something very ordinary. It doesn’t have to be anything phenomenal. All phenomena are either a system or a part of a system. This is why systems and system models is the foundational crosscutting concept (Rehmat et al., 2019) and the arrow in the diagram points from phenomenon to systems and system models.

Systems and system models are tools for describing and explaining systems. A system model is a representation of the components and how they interact. The systems model can include pictures and text. The most important feature of the systems model is that it explains how the phenomenon happens.

Patterns are tools for describing what happens. There are many different kinds of patterns we might notice. We describe patterns using two other crosscutting concepts — scale, proportion, & quantity and stability & change.

Cause and effect is a tool for explaining why something happens. Cause and effect relationships can be simple or complex. We explain cause and effect using two other crosscutting concepts — matter & energy and structure & function.

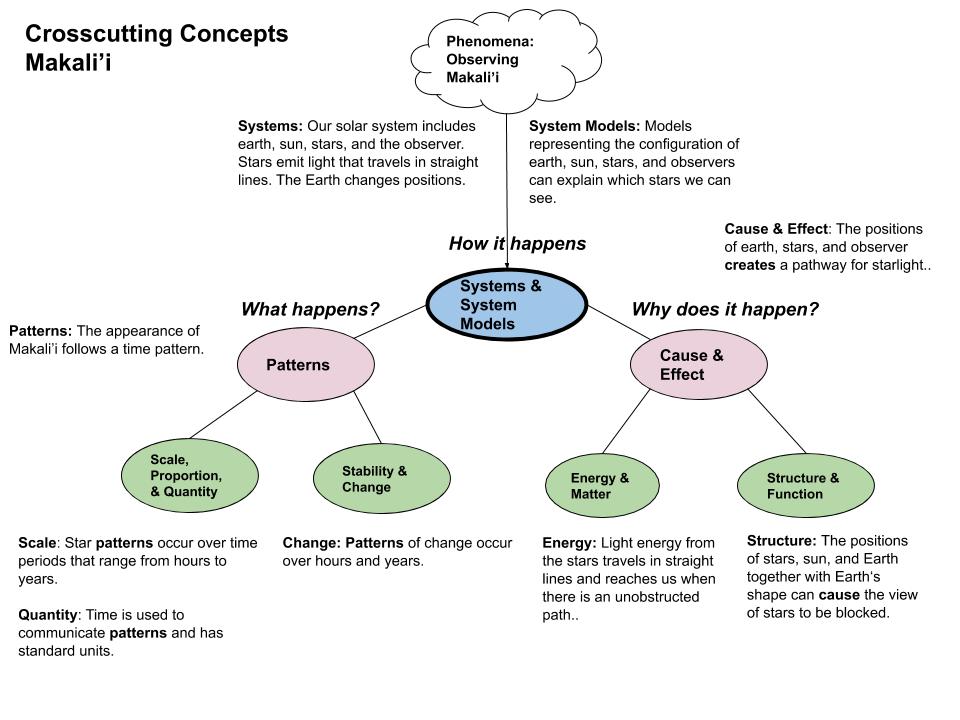
The diagram provides a way to think about how the CCCs operate together as we create system models. In phenomenon-driven instruction, we are going to use many CCCs rather than just one or two. The idea for this diagram came from Rehmat et al. (2019) and I modified it to include phenomenon and adjusted the representation of systems and systems models in the diagram.

By NASA, ESA, AURA/Caltech, Public Domain, https://commons.wikimedia.org/w/index.php?curid=7805481

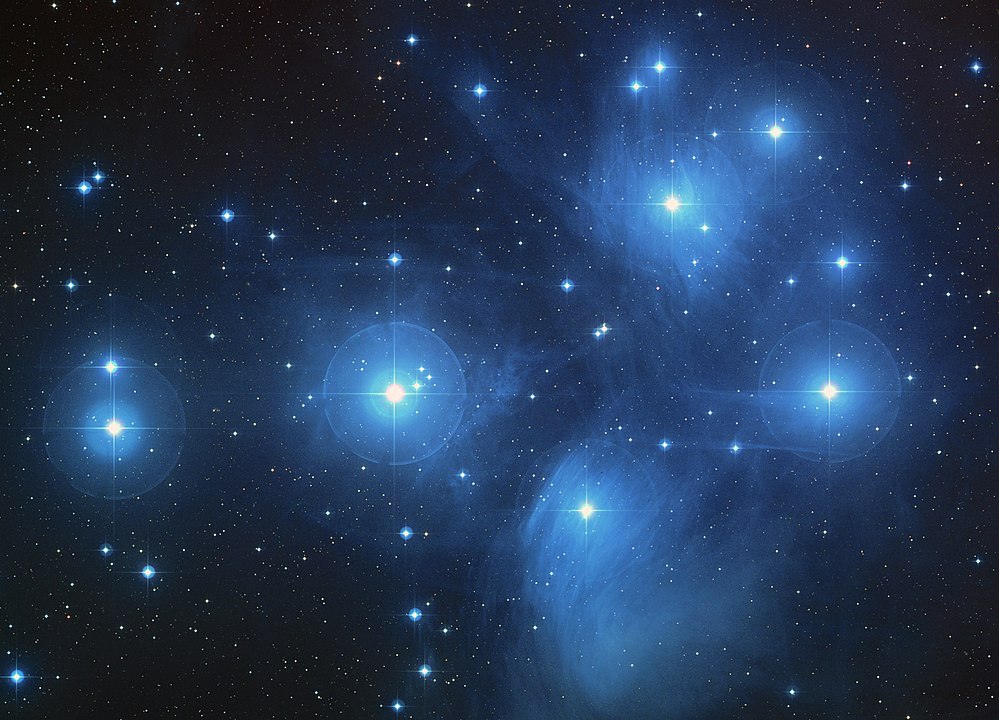
Let’s apply the set of CCCs to an example. One phenomenon is the rising of Makali’i every November, which is used to mark the beginning of the Hawaiian new year.

Makali’i is a group of stars. We see the stars because light from the stars travels to our eyes. Our system model needs to include the stars, sun, and Earth to explain why we see them.

I developed this diagram using the templates on Paul Anderson’s website, Wonder of Science. These are great tools because they are already Google Draw editable documents. I added my system components and supporting text.

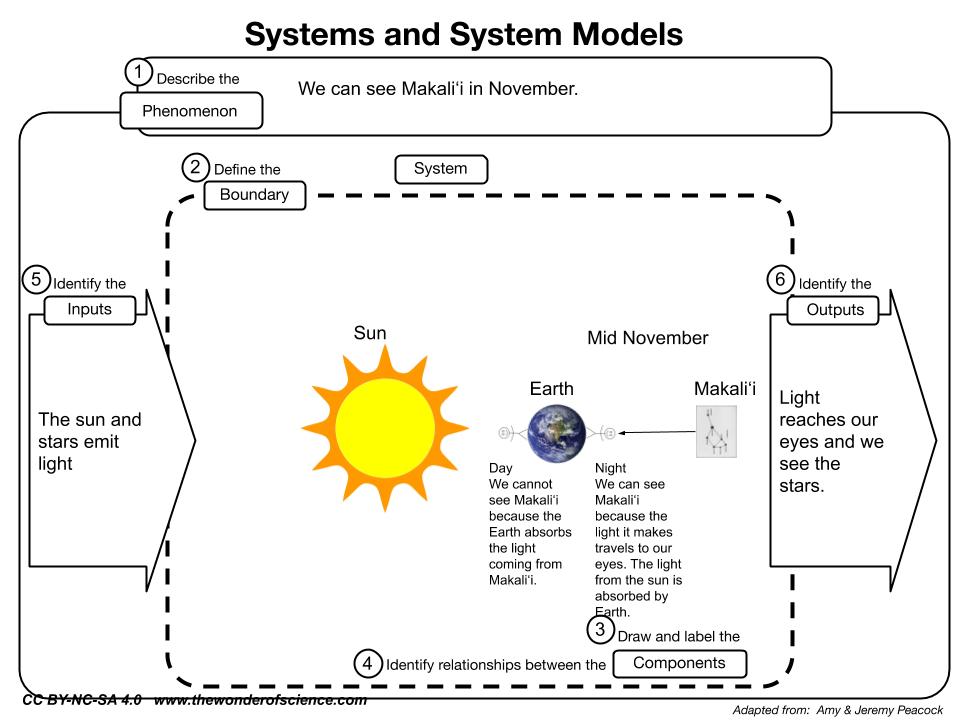
This system model explains how we can see Makali’i in November. Components include: Makali’i, sun, Earth, and observer. Makali’i emits light, which travels to Earth so we can see Makali’i in November. How do we use the other CCCs in the model?

Patterns are what happens in the phenomenon. There is a time pattern of specific months of the year when Makali’i can be observed in the sky. The time is measured with units (Scale, Proportion, & Quantity). Constellation patterns stay consistent over shorter periods of time, such as a month, while changing quite a bit over longer periods of time, such as a year (Stability & Change).

Cause & Effect is why the phenomenon happens. There is a cause, or reason, for the effects we observe. We observe Makali’i because the light can reach our eyes. The light can reach our eyes because the arrangement of sun, earth, stars, and the observer creates an unobstructed path for starlight. Light is a transfer of energy (Matter & Energy). The unobstructed path happens because of the structure within the system (Structure & Function). The Earth itself blocks light from reaching our eyes depending on its position in its orbit and its point in the rotation on its axis.

In the example of observing Makali’i, we see that all the crosscutting concepts play a role in describing and explaining the phenomenon. This diagram shows the role of each crosscutting concept.

So, how would you decide which to leave out? How can we use them together without overwhelming students and teachers?

What do you think about using all the crosscutting concepts in creating systems models that describe and explain phenomena? Leave your ideas in the comments!

References

Rehmat, A.P., Lee, O. Nordine, J., Novak, A.M., Osborne, J., & Willard, T. (2019).  Modeling the role of crosscutting concepts for strengthening science learning of all students. In S. J. Fick, J. Nordine, & K. W. McElhaney (Eds.), Proceedings of the summit for examining the potential for crosscutting concepts to support three-dimensional learning. University of VA. http://curry.virginia.edu/CCC-Summit

Planning Science Units with Equity in Mind

This post gets deeper into Chapter 2 of Ambitious Science Teaching. This chapter explains a systematic unit design process used to create a series of lessons that can build understanding coherently. What struck me the first time I read this chapter is how well this planning process supported creating units that embody the vision of science teaching and learning in the Next Generation Science Standards. This design process is also useful for creating problem-based learning units. This post describes the three practices in this process, how the process builds in some equity considerations, and how the process might be extended to address other equity issues.

The process consists of three major practices:

  • Practice 1: Identifying big ideas
  • Practice 2: Selecting an anchoring event and essential question
  • Practice 3: Sequencing learning activities that build specific understandings

Descriptions of each of the three practices are supported by detailed examples from work with teachers.

Practice 1 includes a whiteboard activity to help curriculum writers select the most important ideas that have the most explanatory power. Considering a tentative anchoring event can help guide this process. These important ideas become the conceptual threads that ties the unit together.

Practice 2 focuses on choosing the anchoring event. Curriculum writers should consider features that make the anchor context-rich and more compelling for their students, such as historical significance or issues of social justice that can motivate interest. See Angela Calabrese-Barton‘s Twitter feed for examples of how to incorporate social justice, such as this one about the water in Flint, Michigan. Students will model and explain the causes of an anchoring event over the course of instruction, and these explanations should integrate multiple science ideas. The anchoring event should be complex enough to provide space for students to create different kinds of explanations.

Practice 3 is a strategy for identifying and sequencing learning activities in a unit. A key part of this planning is a teacher-developed gapless explanation for the anchor event, which should be written just beyond the expectation for students at grade level. Learning activities are identified and sequenced to support development of the gapless explanation.

Although the planning process seems straightforward, there are a few other things we might consider in planning for equity. Equity is a key concept in AST (see my post on Chapter 1). The authors made strong connections between the anchoring event and equity, but they did not make connections between the gapless explanation and equity.

Who decides on the content of the gapless explanation?

Philip Bell raised an interesting question on Twitter about gapless explanations. From whose perspective are they gapless? It is important to consider explanations from multiple perspectives and not focus only the Euro-western perspective. How can different ways of knowing be recognized and developed in science teaching? There is much work to do in this area that has the potential to increase equity. We need to acknowledge and build upon the funds of knowledge that all students bring to school science. We need to expand our views of science as a way of knowing to be more inclusive of all cultures. There is a lot of work that remains to be done in this area.

I appreciate reading the posts from my science education colleagues on Twitter that help deepen my understanding. I look forward to working with members of the #ASTBookChat group as we explore AST together.

What are your thoughts about the AST unit design process? What other ways could the unit planning process be more attentive to equity? Share in the comments!

How do we know the Earth is moving?

This post is my musings about transitioning 5th-grade students from an Earth-based perspective to a space-based perspective. Research literature shows that students need experiences to make sense of a space-based perspective to be able to explain the patterns caused by Earth’s motion. Here’s a sequence we could use.

One of the first patterns that children notice is the sun rising and setting. We can explain this pattern with a conceptual model of the sun moving around the Earth. However, other phenomena are not explained well by this model. The moving–sun–stationary–Earth model has limitations. When new evidence cannot be explained by our model, we must revise it.

What evidence do we have about Earth’s motion? Consider the following video that is an astronaut’s view of the Earth from space.

Video taken by Galileo spacecraft in 1990

This video is clear evidence that the Earth is moving. What other phenomena are caused by Earth’s motion?

Here’s a time-lapse video of stars near the North Celestial Pole.

How does a spinning Earth cause what we see in this video? How can we use a model to explain it?

The next example is a little more abstract. How could gravity be related to Earth’s spinning?

Gravity can be evidence that the Earth is spinning. Let’s think through this. Remember the last time you rode on a spinning ride? Maybe it looked something like this one. What did you feel? You feel pulled to the center. Like the girl in this picture who is pulled to the center.

The spinning of the Earth causes objects to feel pulled toward the center of Earth. At the equator, the surface of the Earth is spinning at 1000 miles per hour. So observing a force pulling an object towards the ground is evidence of Earth ʻ s rotation.

After considering these three phenomena, students may be more willing to consider that the Earth is moving. Then they can start using a space-based perspective and we can explain a lot more phenomena, such as why the path of the sun is different at different times of year. This is needed to explain the reason for the seasons, which is a middle school expectation.

Adjusting complexity of data with representations

In my last post, I pondered how to integrate skills across math, ELA, and science in a lesson about falling objects. The mathematics content quickly became a little complicated for fifth grade. What other ways can we represent data to make it more accessible?

My next idea was to look at a ball drop over a longer distance. I found a video of a ball dropped from the roof of a building that was a sample video in Video Physics from Vernier Software. I used Video Physics to mark the position of the ball in every 10th frame of the video. These marks are a visual representation of the data.

Sample video of ball drop with and without markings

Gathering evidence

Students can look for patterns in the spacing of the marks. They should notice the marks get farther apart as the ball falls. How is this evidence of the direction of gravity?

The person released the ball and it fell. The observation that the ball moves downward is evidence that some force pushes or pulls down. But what about after the release? Is that force still pushing or pulling down? How do we know?

The pattern of the marks gives us clues. The marks show the ball position at evenly spaced time intervals. The ball moves farther during each time. This means the ball is moving faster. What made it move faster?

Teacher content knowledge

Here is a little refresher about elementary physical science and the topic of forces and motion. Students learn about forces and motion in several grades.

  • In kindergarten, students explore the effects of different strengths and directions of forces on motion. They also compare design solutions for changing the motion of an object. (K.PS2-1 and K.PS2-2)
  • In Grade 3, students investigation the effects of balanced and unbalanced forces on the motion of an object. They also learn to use patterns of motion to predict future motion. (3.PS2-1 and 3.PS2-2)

Student inferences

In Grade 5, we ask students to transfer knowledge from their prior observations of contact forces (pushes and pulls) to a non-contact force (gravity). They should already know that to make something keep getting faster (accelerate) requires continued pushing or pulling in that direction from explorations in kindergarten and grade 3. Applying that to the falling ball, students can infer that something must be pulling or pushing the ball toward the ground to make it go faster.

Once students have made this inference, they are ready to learn about the concept of gravity. Gravity is different than pushes and pulls. The Earth pulls on the ball because the Earth is extremely large. The pull of Earth on objects is gravity.

When the person holds the ball, the forces are balanced. The upward force of the hands on the ball balances the downward pull of gravity. After the person releases the ball, the forces are unbalanced. The downward pull of gravity makes the ball speed up as it moves toward the ground.

The next step is for students to create an argument with grade-appropriate ELA skills. Those CCSS were listed in this post.

Did you find this post helpful? If so, let me know in the comments.