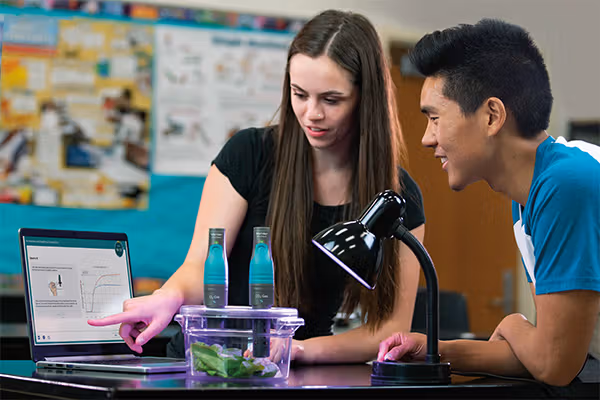

In classrooms across the country, something revolutionary is happening. Students are no longer just reading about science—they’re doing science. At the heart of this transformation is Vernier Connections powered by Penda, an exciting collaboration between Penda Learning, a leader in standards-based science instruction, and Vernier Science Education, known for its high-quality data collection technology.
This partnership is more than just a tool mash-up—it’s a visionary model for 3D learning in action, helping schools bring the Next Generation Science Standards (NGSS) to life through authentic, data-rich inquiry experiences. Here’s why.
1. Phenomena-Driven, Sensor-Powered Learning
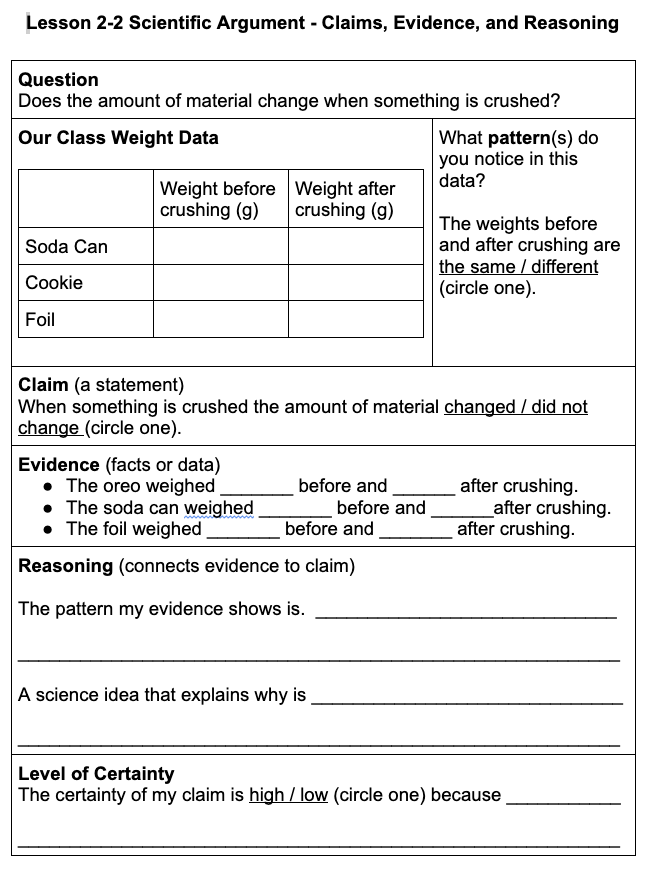
At the core of every Vernier Connections lesson is an anchoring phenomenon—a real-world event that’s puzzling, observable, and immediately relevant to students. Think: “Why do different surfaces heat up at different rates in the sun?” or “What causes a sudden drop in oxygen levels in a pond?” These are not trivia questions. They’re investigative invitations that drive students to ask, explore, and explain using science practices.

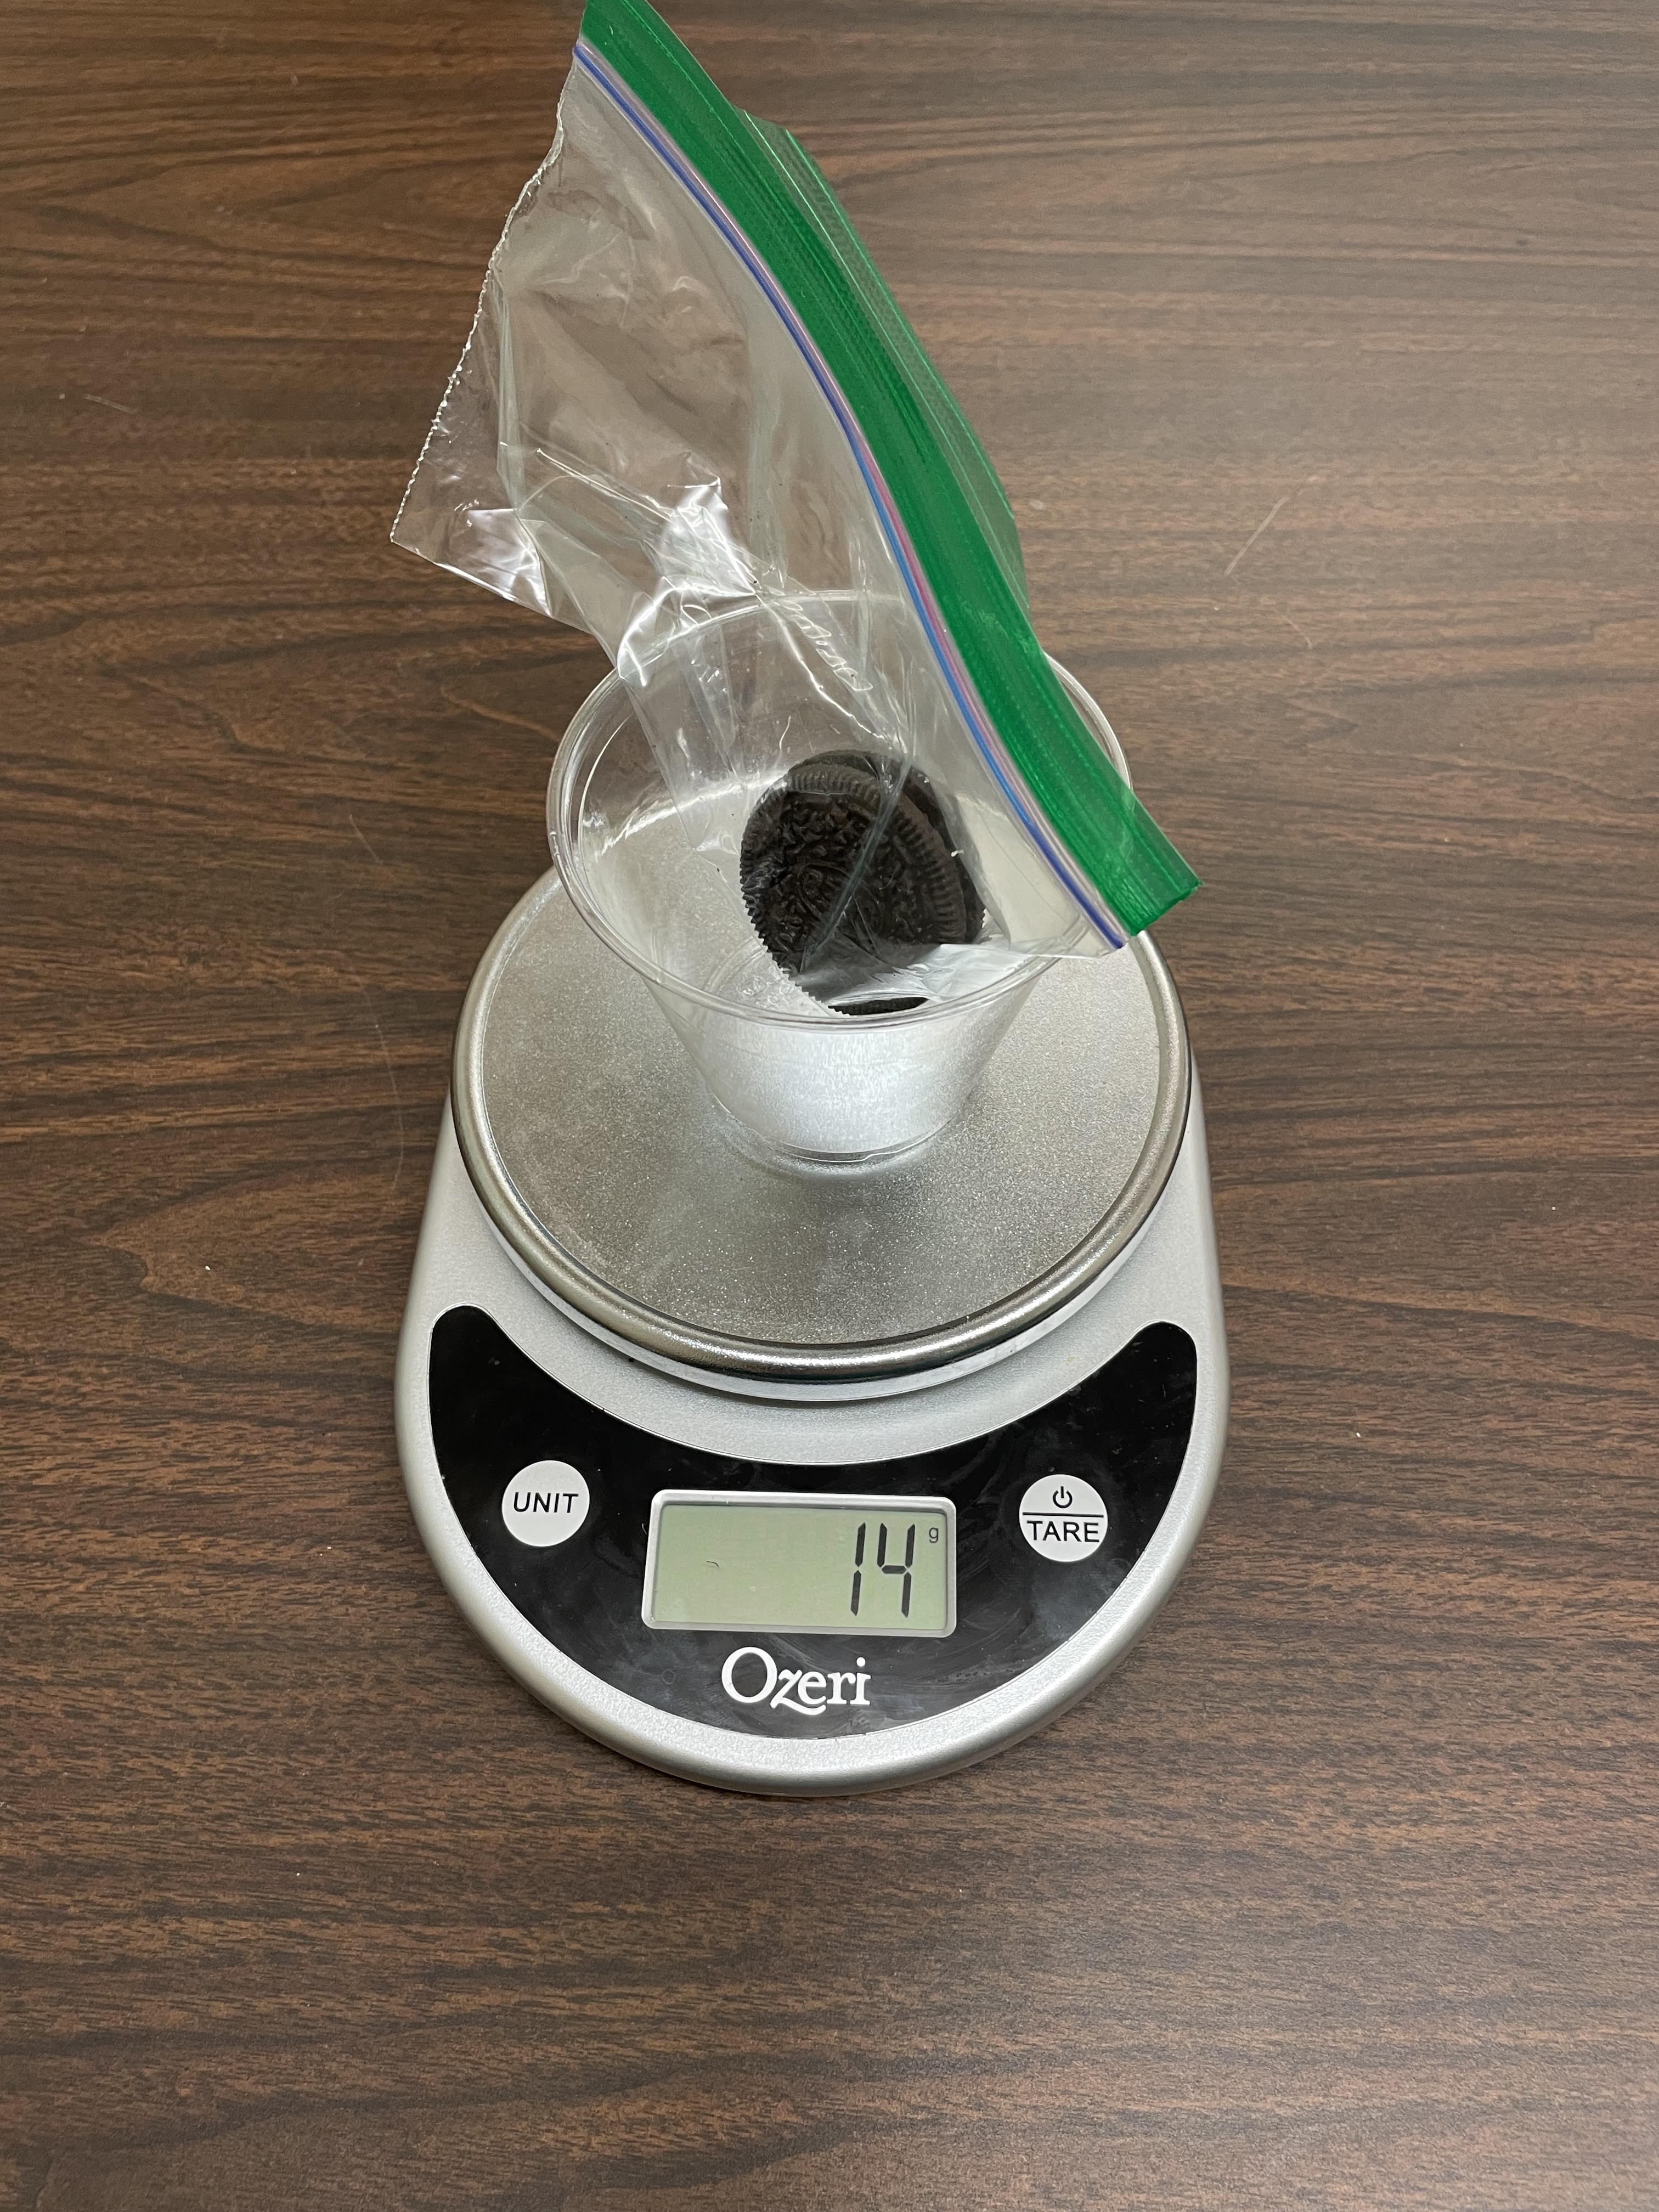
Students investigate these phenomena using Vernier sensors—like temperature probes, CO₂ sensors, and motion detectors—to collect real-time, high-quality data. Suddenly, the classroom becomes a lab. Students become scientists. And learning becomes discovery.
2. Seamless Integration of NGSS 3D Learning
Every lesson is built from the ground up to integrate the three dimensions of the NGSS:
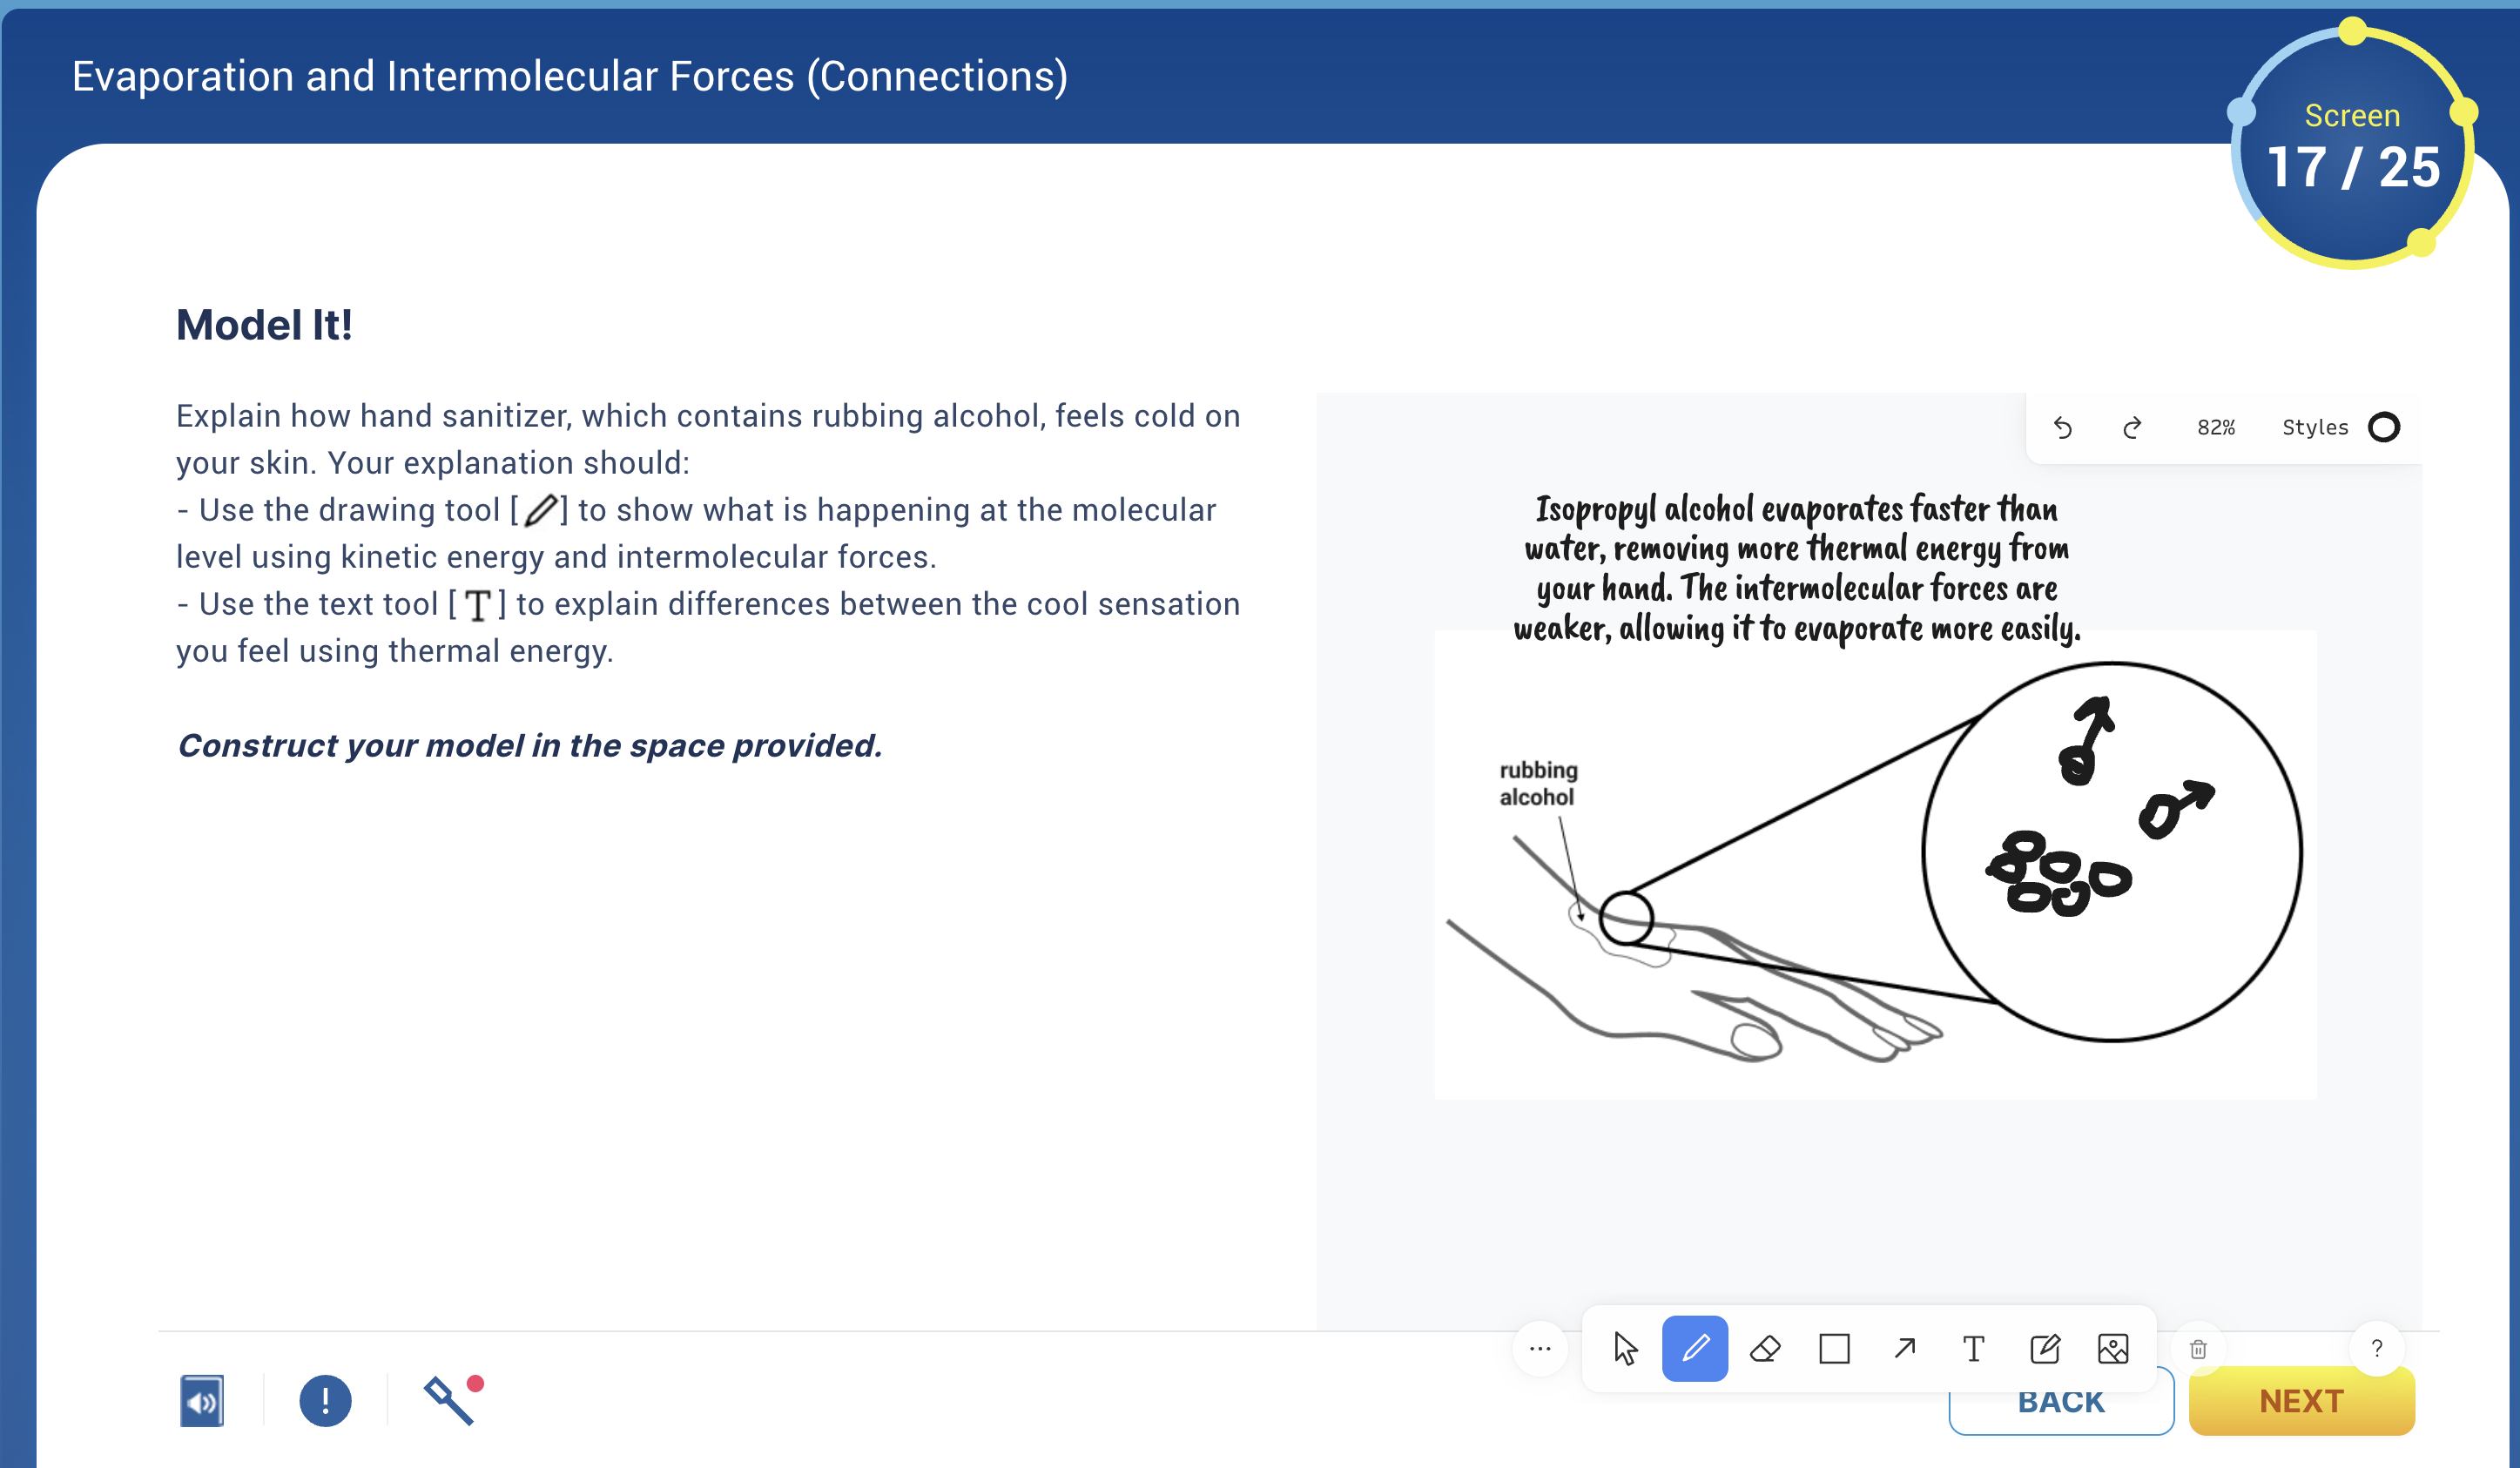
- Science and Engineering Practices: Students plan investigations, analyze sensor data, revise models, and construct explanations based on evidence.
- Disciplinary Core Ideas: The content isn’t taught in isolation—it’s learned as students make sense of the phenomenon.
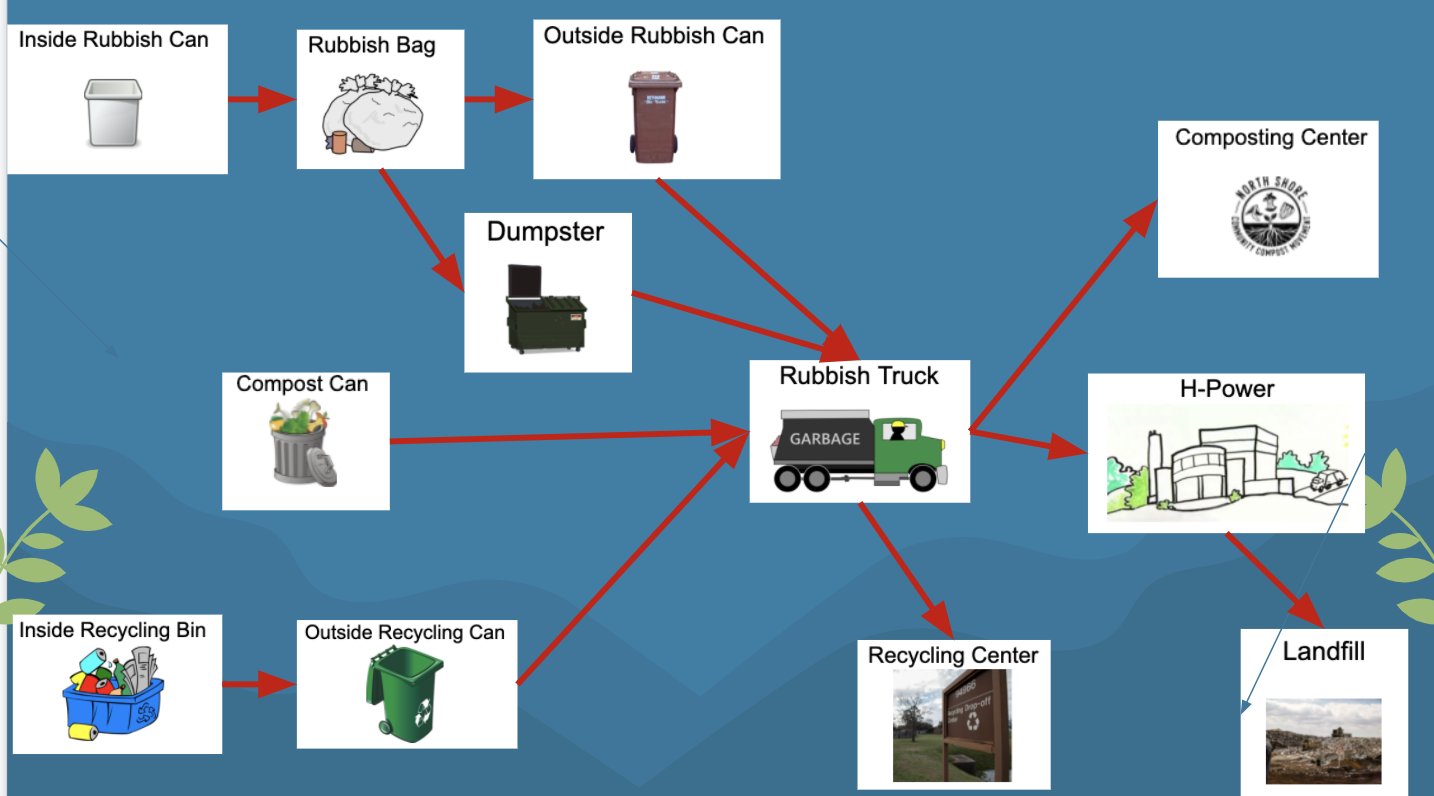
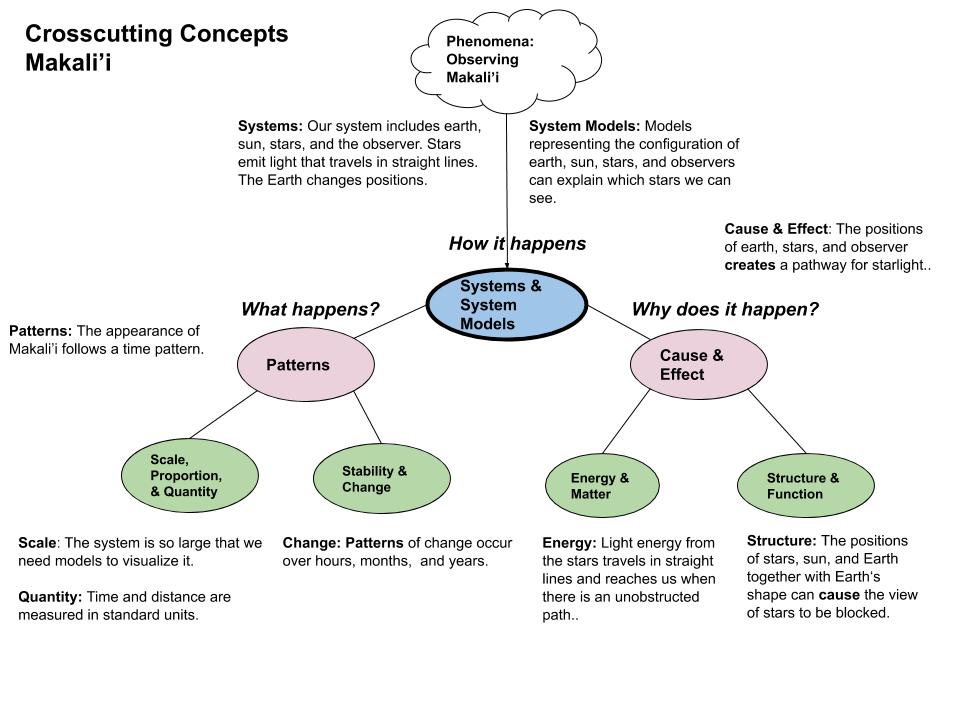
- Crosscutting Concepts: Patterns, systems, cause and effect—all are embedded as tools for thinking, not just vocabulary to memorize.
Vernier Connections lessons don’t just align with NGSS—they embody the instructional shifts that NGSS demands.
3. Engaging, Structured, and Student-Centered
Each lesson scaffolds the student experience from curiosity to explanation. It’s not a lecture or a worksheet. It’s a guided inquiry experience.
Students:
- Observe the phenomenon
- Predict and question
- Design and conduct experiments with Vernier tools
- Analyze and model their understanding
- Apply knowledge to new contexts
And all of it happens in a platform that supports differentiation, standards-based feedback, and visual tracking of student progress.
4. From Curiosity to Mastery—with Data That Matters

What’s especially innovative is how students use sensor data not just to complete a lab, but to build scientific explanations. They’re asked to defend their thinking, revise their initial ideas, and apply their understanding to new phenomena.
It’s not about getting the “right” answer—it’s about developing a coherent understanding of the world, the way scientists do.
5. Teacher Empowerment with Flexible, Ready-to-Use Resources
Each lesson is teacher-friendly, with built-in assessment questions and clear alignment to NGSS performance expectations. Teachers don’t have to start from scratch or rework clunky lab instructions. The Vernier Connections format offers clarity without rigidity—a balance of structure and flexibility that honors teacher expertise.
Why It Matters
Vernier Connections is a model for how to teach science as it was meant to be taught: grounded in wonder, fueled by evidence, and connected to the real world. In a time when we urgently need critical thinkers and problem-solvers, this approach helps students develop not just content knowledge, but the mindset and methods of science.
If we want students to act like scientists, we need to give them tools, questions, and experiences that matter. That’s exactly what Vernier Connections does—and that’s what makes it a game changer.